Submitted by Ambrose on Sun, 2013-04-14 08:22
I’ve mentioned this before to people but never wrote it down: How should we even begin to handle graphs and diagrams? What is the “alt text” for a graph, a schematic, floor plan, infographic, or UML diagram?
Just consider this diagram:
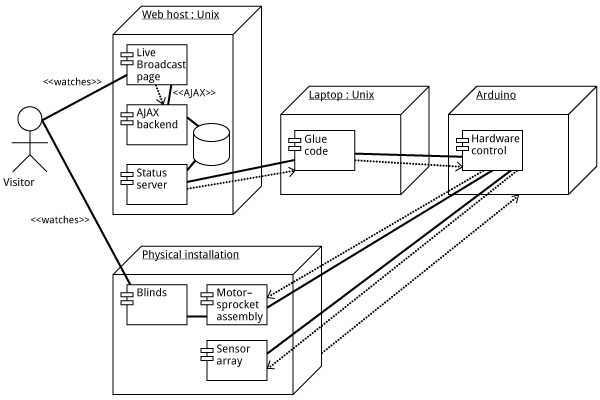 How should we even describe this as an “alt text”? (Let’s ignore text browser users for the moment.) Describing the picture certainly wouldn’t work; what matters are not the visual elements themselves, but their relationships to each other.
Even worse: Imagine this being exported into PDF (or SVG, or EPS), then embedded into InDesign. Suppose the InDesign file is going to ultimately end up as an accessible PDF. But the text in the diagram is going to be a jumbled mess. So what accessibility are we talking about? Are we deluding ourselves?
This has serious implications: Imagine, for example, a piece of online instructional material full of such diagrams. Under the AODA organizations are supposed to be able to supply this in an “accessible format.” What does it even mean for this to be accessible?
How should we even describe this as an “alt text”? (Let’s ignore text browser users for the moment.) Describing the picture certainly wouldn’t work; what matters are not the visual elements themselves, but their relationships to each other.
Even worse: Imagine this being exported into PDF (or SVG, or EPS), then embedded into InDesign. Suppose the InDesign file is going to ultimately end up as an accessible PDF. But the text in the diagram is going to be a jumbled mess. So what accessibility are we talking about? Are we deluding ourselves?
This has serious implications: Imagine, for example, a piece of online instructional material full of such diagrams. Under the AODA organizations are supposed to be able to supply this in an “accessible format.” What does it even mean for this to be accessible?