graphic design

Legibility research, and the perils of citing just the URL

During a recent discussion on EAE the question of the “readability” of two spaces came up. Naturally, since I originally planned to do my thesis in graphic design but failed to find relevant research, I was deeply skeptical.

At the end I was asked if I would be interested in learning about the “science” of readability and, of course, I said yes. Today the person got back to me, and this is the list she gave me, in its entirety:

  1. http://ieeexplore.ieee.org/abstract/document/6392140/?reload=true
  2. http://journals.sagepub.com/doi/abs/10.1177/1470357211434029
  3. http://www.ingentaconnect.com/content/stc/tc/2005/00000052/00000004/art00006#expand/collapse
  4. http://www.ingentaconnect.com/content/stc/tc/2000/00000047/00000003/art00009
  5. Lewenstein, M., et al. "Poynter Eyetrack Study." (2000).
  6. Quinn S., Stark P., Edmonds R. (2007) Eyetracking the News: A Study of Print and Online Reading. New York: The Poynter Institute.

I’ll leave aside my pet peeves about URL abuses for now; but when I checked the URL’s I found only a third of the list still accessible: [3] and [4] are 404’s. And [5] and [6] could not be located. Not even Google knows where [5] and [6] are: Poynter has “reorganized” their site and they haven’t placed redirects for their old links, even though there’s no way they’re not aware they have been widely cited.

When all the unlocatable citations are thrown out, the entire reference list contains only two citations.

Both of these ([1] and [2]) are behind a paywall, and I couldn’t read them at my home university. I can track them down, which I will do, and comment later when I’m better informed, but I’m already less than hopeful: [1]’s abstract shows suspicious terminology (such as “font size”) that casts doubts on the study’s methodology.

What does this mean? I don’t know, as I’m not really well informed at this point yet, but the terseness of the list still seems to suggest I wasn’t totally crazy when I tried tracking down research papers but failed.

Of course this is graphic design…

Yesterday I was mentioning to Emily that I couldn’t understand some of the graphic design work on the 5th floor. One looked like it came from Industrial Design. But the bulk of what I couldn’t understand looked just like installations.

Then today, while I was trying to find all my friends’ work in the final two hours, I ran into another one, Zviko Mhakayakora’s This Feels Like Home:

<cite>This Feels Like Home</cite> at GradEx 101

However, this time, although at first I felt puzzled for a short while, as soon as I read the artist’s statement I thought, “Of course this is graphic design!”

Context made all the difference. The designer framed this as an educational exhibit, and it clicked on me: This is environmental graphic design work for a museum exhibition. Graphic designers do this kind of work all the time.

So EGD is being taught at OCAD, and I think it appears to be taught well. One day, maybe OCAD’s campus will actually have good EGD.

Org charts are not trees

The first thing I tried was to read about D3 and tried to modify their example code to see what I could come up with. And then I realized something Very Important: Org charts are not trees. I should have known better. I had drawn org charts before and had already found out back then that org charts are not trees (okay, maybe for “normal” businesses they are… but a lot of nonprofits don’t have “normal” structures, so any alleged normality is only illusory). So all tree-based layouts are out. Back to square one…

First thoughts

I got the file yesterday but I just started looking at it. A few problems stood out right away:
  1. I can’t read the names; they are too small. Even in Preview I have to zoom in twice for the names to even become legible.
  2. I actually don’t understand the relationships. The way they drew the “members” box makes it look like committees aren’t composed of members. (And are staff members?) And the arrows are confusing. They jump over boxes without indicating they’re jumping over things, and boxes in their way appear to be sometimes also connected to the arrows.
And of course a few thoughts jumped out right at once too (yes, even before the problems, actually):
  1. Do I need to do it in a file format they can update? Does this mean I have to do it in Word? (No…)-:
  2. The org chart on the site is the same as the Word file I was given, only that what’s on the web is a pixel dump of the real thing. Does that mean I should do it as a web app of sorts?
  3. Would D3 be of any use?
How should I even start thinking about this?

I didn’t know @SEGD has changed its name

Earlier today I went to SEGD’s site to look for some information. (I forgot what I was looking for…) Much to my surprise, I noticed that it showed its name as the Society for Experiential Graphic Design. I never knew of the change, and according to the What is Environmental Graphic Design article on SEGD’s site, they changed their name way back in 2013. The same article mentions EGD as becoming the “enabler of Smart Cities.” So things are actually falling into place… (just not where I want them to be, I guess…)

Graphic design seen from another perspective

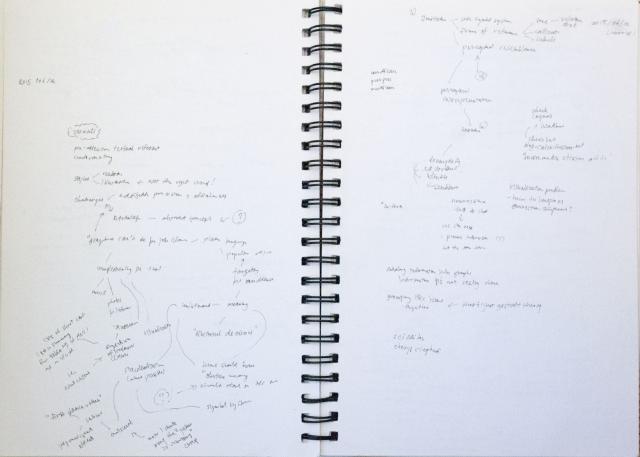
You might not think an editors’ conference would have anything to do with graphic design, but in fact it did. Other than getting to know “industry standard” practices and expectations, it was revelatory to look at graphic design from the (stereotypical) editor’s viewpoint. My two surprising finds: Graphic design is misunderstood in editing circles, and bad graphic design is giving graphic designers and other artists a bad name. Since summaries of the relevant sessions have already been posted, I’ll just comment on a few observations I had. “Graphic designers,” it was said during the Q&A at Sunday’s “Clear Communication” session, don’t care about communication but instead care “only about visuals.” This is, of course, a grave misrepresentation, since graphic design is all about communication. In fact it is so much about communication that it’s also called “communication design”; I find it incredible that a quarter century after graphic design has been called communication design people are still claiming that graphic design is not about communication. So how did this misrepresentation come about? Friday’s “How and What to Edit in Visuals Accompanying Text” gave us a clue. The presenters showed a lot of badly designed visuals that don’t communicate (including apparently-not-to-well-conceived illustrations, badly designed infographics, and badly set text). Eventually I just had to say “bad graphic design is giving us artists and designers a bad reputation.” Editors have this misinformed idea that communication design isn’t about communication because there is simply too much bad art out there. Outside the art and design circles, it also appears that the term “illustration” is misunderstood, since one of the presenters said the style of a graphic can be “realistic” or an “illustration”—The problem here, of course, is that illustrations can be realistic. “Illustrations” is not the right word (which should be a big problem in an editing conference); the correct word should be “caricatured.” (My handwritten notes for the session “How and What to Edit in Visuals Accompanying Text”) The idea of caricature returned later when the “suppression (?) of irrelevant details” was mentioned. Suppression of irrelevant details is, of course, caricature. Strangely, McCloud’s Understanding Comics was actually mentioned. Perhaps the word is too technical for people outside art the design circles—or perhaps I see it as a normal word only because I’ve worked so long with this prof. We all know that colours have cultural significances, but I found it bizarre that at one point it was suggested that yellow should not be used because it would be misunderstood as indicative of a warning. I was shocked; not even American and Canadian designers would agree to that statement, and the example was an illustration. I had always felt Ontario to be boring but I’d have never thought of this as one of the reasons; in a multicultural country like Canada such a claim also sounds culturally biased. It was also mentioned that (if I read my notes correctly) neuroscience tells us that our brain cannot hold more than seven pieces of information at the same time. But I was skeptical because this contradicts Malcolm Gladwell’s claim (which I happened to be able to check because I happen to be from the right linguistic background). That said, since I’m actually working on a neuroscience project right now maybe I need to somehow weave this claim into some sort of query that I can ask the neuroscience people; this might prove productive :-) This is about all in terms of comments I can still make out of my notes, but perhaps I should mention two more interesting connections near the end: “Grouping like items together” was mentioned (Gestalt theory, something I’ve never been strong at); and reading information that isn’t really there into graphs (semiotics—debates around iconicity in particular—, another thing I’ve never been strong at). There was actually more semiotic talk earlier when perceptual resemblance (and of course, the comment about yellow that I disagreed with) was mentioned. This has little to do with editing but I guess these are reminders that I should brush up on my theory. For some reason that I’ve already forgotten, I tweeted a few times during Sunday’s session but didn’t take any notes. Why I didn’t take any notes on Sunday will forever remain a mystery…

Why graphic design is not dead

DK and I chatted a bit yesterday about GradEx. We quickly went to “What is the point of this exhibition,” then to “Our program has no personality,” and then beyond. But as I pondered this today I realized that the fact that our program has no personality is not a showstopper. Bringing organization to disorganized elements and imposing a scheme to a composition that has no harmony shouldn’t be something foreign to us: This is what graphic designers do. I still remember during the post-conference townhall at AIGA’s 2012 “Pivot” conference when Ric Grefé talked about the importance of keeping our “craft” or risk losing our “specialness.” I was skeptical we had anything special to talk about. Doesn’t everyone have our technical skills these days? And then I was not even a good graphic designer. But the amazing thing is that even a not-so-good graphic designer who has never even been properly trained was able see problems that even people trained in other design disciplines apparently failed to see. I see this as validation of Ric Grefé’s claim: We do have something special (I still don’t know what it is), and our specialness does not lie in our technical software skills—our “craft” is something else. Which I believe brings us back to “What is the point of this exhibition.” When I chatted with the guy who’s showing sculpture next doors today one thing I mentioned was that I wanted to do GradEx because I didn’t feel I finished until I do this. When NW said it’s almost finished and I said “Two more days!” I really felt those were the right words to say. For a design student, the end is not having thesis done (“I thought thesis was hell; GradEx is also hell,” as relayed by RT), neither is it having technically graduated (as I so call my awkward situation), nor is it convocation; the end is having gone through GradEx, in all its “hellish” ways. Like what DEEP and INCD’s “Culminating Festival” should have been, GradEx is a full environmental graphic design (EGD) project, complete with inclusivity and accessibility issues to solve. This year’s two cohorts have not tackled it rightly, as an inclusive design problem (to be fair, neither has OCAD Administration tackled it rightly, as an EGD problem), so we have mostly squandered the precious opportunity. I wish next year’s cohort will take GradEx more seriously for what it is—an EGD project worthy of tackling from an inclusive design viewpoint.

Getting lost at York University

I was meaning to get to York University for a talk this morning. My being late aside (I missed almost the entire talk and only caught some concluding remarks and the Q&A at the end), when I finally got to York, I spent who-knows-how-much-time on finding the correct building. Which, clearly, was not something I expected. Somehow, I thought OCAD’s wayfinding system was bad, and all the other schools’ systems are better. This is clearly not true, since this is the second time in three weeks I got completely lost in a university campus that is not OCAD U. This probably shows a couple of things: First, the existence of campus maps outside buildings is not enough; the placement of maps are also important. (U of T has an entire section devoid of campus maps; at York it took me more than 15 minutes after getting off the bus to finally find a map.) Of course, at OCAD campus maps do not even exist except inside buildings, so their existence is still a problem that needs to be solved. Also, the wayfinding system at York shows that directional signs without an accompanying map are useless unless you are already fairly familiar with the place. A signpost wouldn’t show you where to get to all building (unless, perhaps, we are talking about a small campus like OCAD’s), so directional signs need to be complemented by campus maps.

Web accessibility is straightforward, or is it?

One of the two things I needed to do in the past week was to post some information on an existing web site. Pretty straightforward information really, but how do you mark it up? Here is the copy, in disguised form of course:
Aardvark New Year Dinner Saturday, February 21 New Aardvarkia Banquet Hall Cost: $38 (VAT included) 6:30pm: reception 7:00pm to 9:30pm: dinner and speaker presentation Join us in celebrating the Year of the Aardvark! Noted author Tia Aardvarka will be present to talk about her recent work, Attack of the Zombie Blue Aardvarks and the Re-emergence of Totalitarianism.
The copy was to be posted in a Drupal-based system that deletes HTML5 semantic tags and aggressively strips away most attributes (including even language and ARIA attributes). The CSS stylesheet is locked down so you can’t create new styles. Most of the existing styles seem to be UI-related and not much is useful for styling content. So how do you mark this up, especially the top two blocks? The first line is easy: It’s an h2. The usual lazy way to mark the rest of the first block up would be to treat it as a list and style the bullets out, but you can’t, because you can’t change the stylesheet. You could treat it as a single paragraph with br tags but this will sound awful with a screen reader. Or maybe you could do multiple divs, which sort of makes sense but then you can’t create the space between the various blocks. The second block is obviously true tabular data, but if you styled it as a table there’d be an odd-looking space on the first row because the first cell on the second row contains so much text. So do you treat it as a table, or do you not? If you don’t, you get into the same situation as the first block. So even this seemingly straightforward copy is creating a lot of problems. How do you handle such situations in a locked-down environment? Perhaps, perhaps we should start by doing some experiments so that we can know how to rank our options?
Syndicate content